Visualizing the height of the Netherlands
The Netherlands is very flat country, with most its area below sea level. So how flat is it really, and how to we keep the water at bay? Let's visualize the official "height" dataset of the Netherlands to find out!
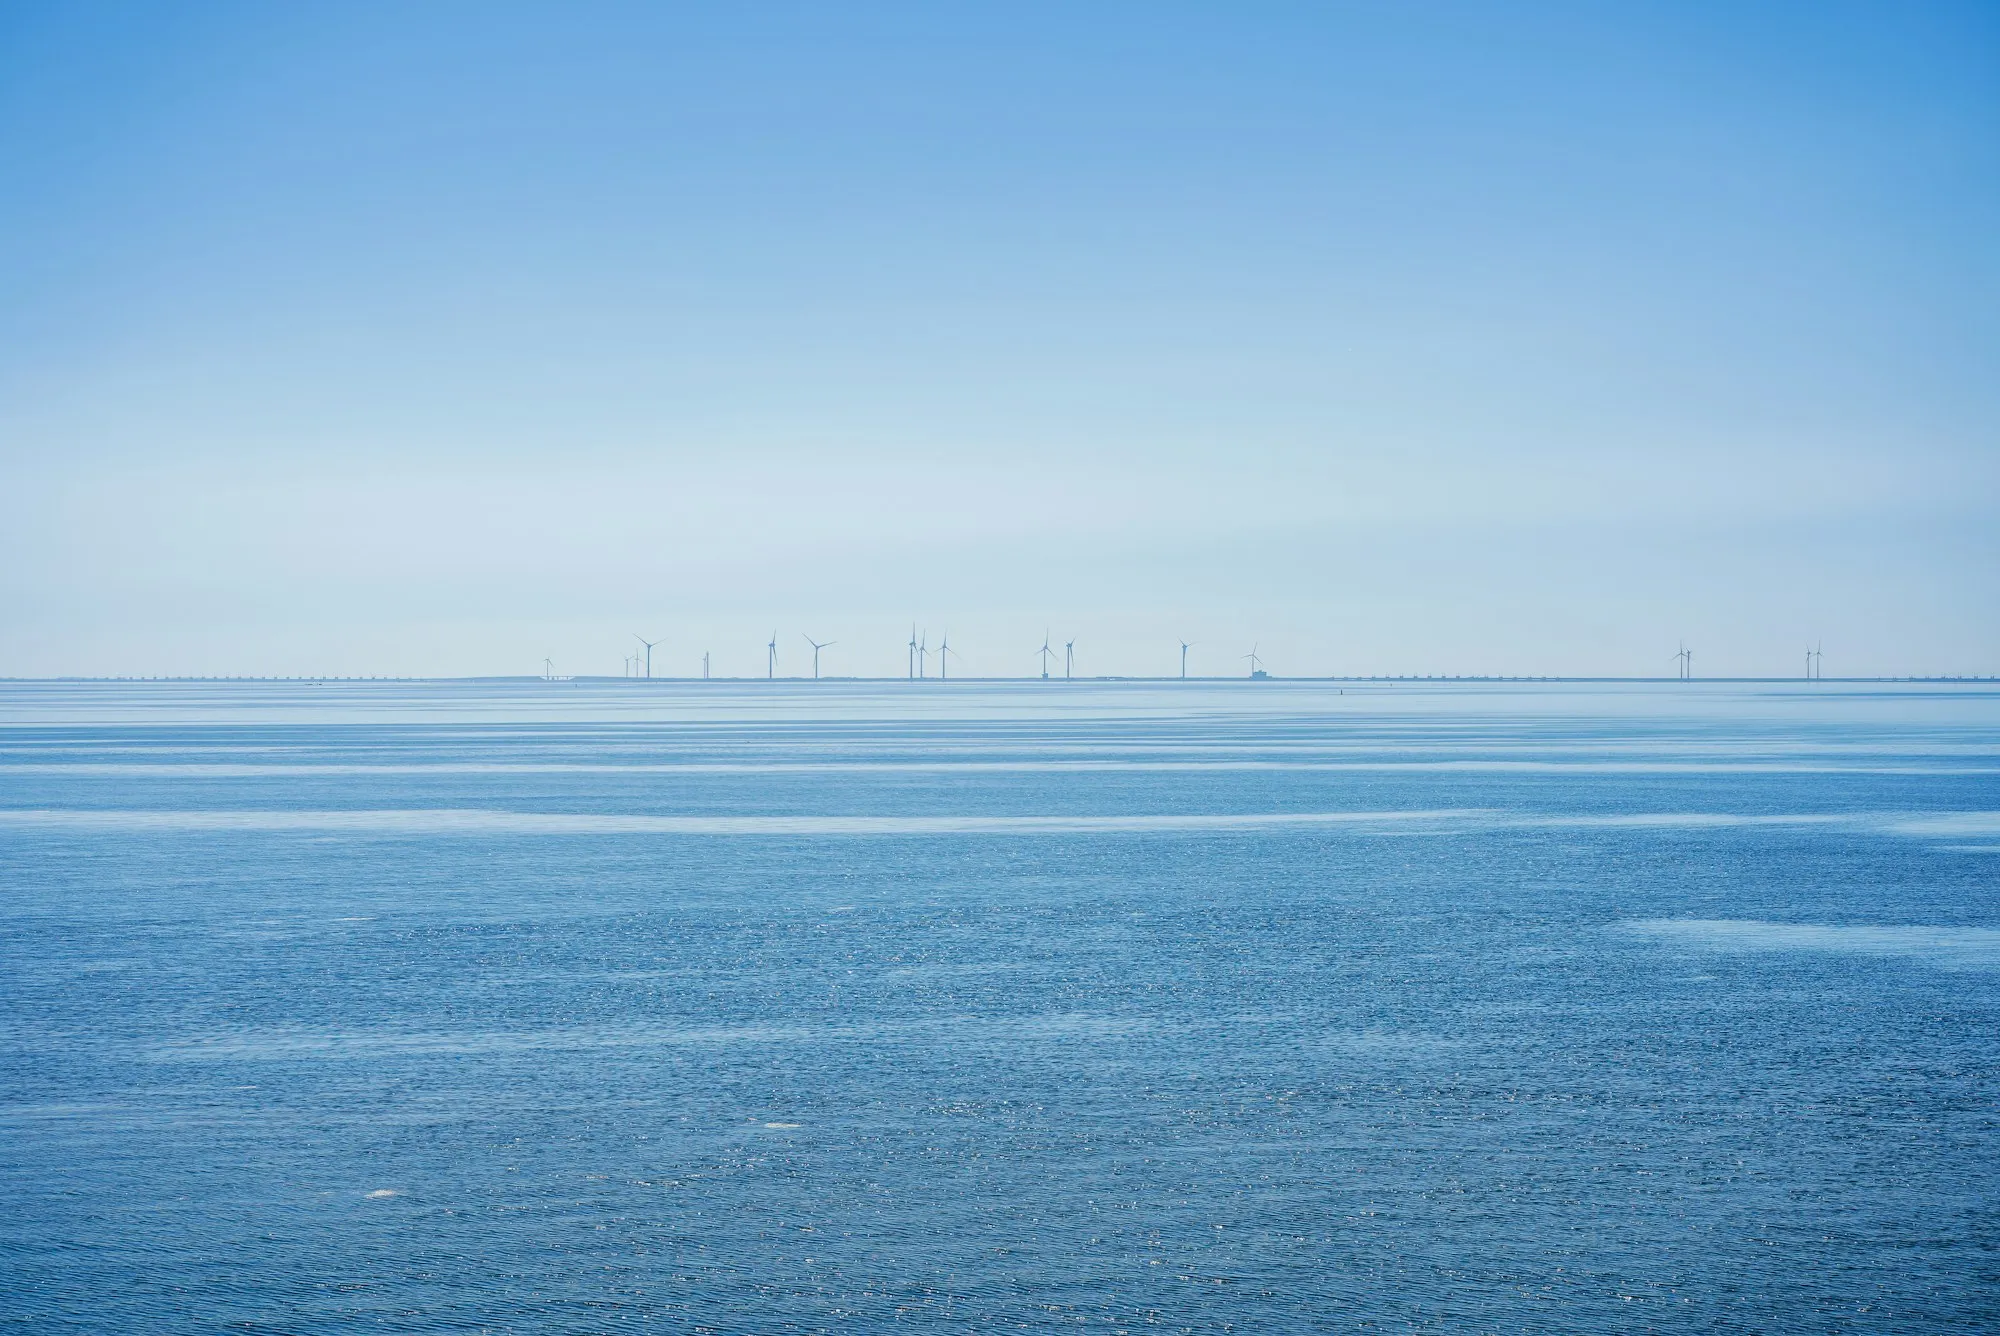
On this date 65 years ago, February 1st 1953, the Netherlands experienced its greatest flood till date, the North Sea Flood of 1953. It remains one of the country's worst disasters: more than 1,800 people died and tens of thousands lost their homes.
The Netherlands earns its name because large parts of the country lie below sea level. To keep the water out, we have built barriers, dams and dykes. We never want another 1953.
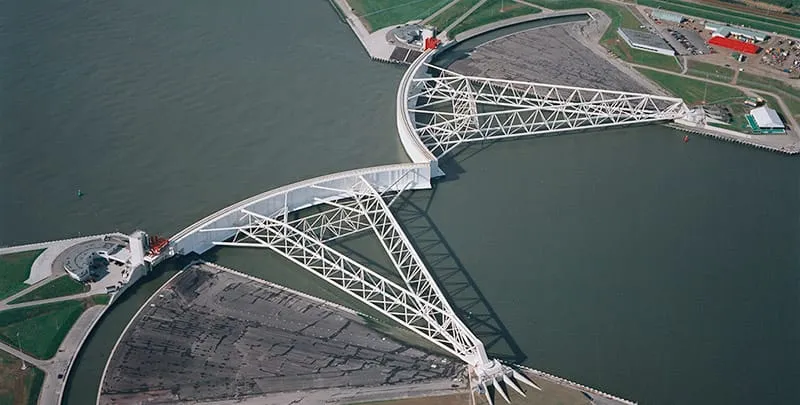
Early this year, a heavy storm drove water levels high and tested these barriers. All five of our biggest barriers had to close at once, for the first time since they were built. We can ask ourselves the question whether this will happen more often now that sea levels are rising due to global warming. A higher base line sea level increases the chance for even higher water levels when it storms. To see which areas a flood would hit hardest, we built a visualisation of the Netherlands' height above sea level.
Things to check out
- The Y-axis shows deviation from “Amsterdam Ordnance Datum“
- You can zoom on both the map and the elevation profile (by selecting a region in the bottom profile).
- If you hover your mouse over the elevation profile, a red dot will show you the location on the map
- The highest point in our country is the Vaalserberg, with a whopping 322 m! It’s in the far south. Some people, however, may claim it’s not really part of the Netherlands because of their ugly accents ;)
- If you zoom in on our shorelines, you can see our dykes
Elevation profiles of the Netherlands
Technical details
Quick links
- Data source: http://ahn.nlWe use AHN version 2 and the dataset with a resolution of 5 meter
- Written in Python and CoffeeScript, and available on Github: https://github.com/lrvdijk/nl-height
Algorithm overview
- The public height data comes in many raster files. The AHN website has a “ahn_units.shp” shapefile, that shows which part of the Netherlands is covered by which raster data file, and thus shows which file to download.
- We import this ahn_units shapefile in a PostgreSQL database with the PostGIS extension enabled. A script downloads and extracts all available raster data files.
- When all data is downloaded, we import the raster data in our PostgreSQL database.
- To generate an elevation profile, we draw a line horizontally across the Netherlands and query which cells in our raster data hit our line. Each cell contains the height at its midpoint. Our query is based on this blogpost: http://blog.mathieu-leplatre.info/drape-lines-on-a-dem-with-postgis.html
- When there’s water, no data exists in our database. We apply some post-processing such that our visualisation does not get weird artefacts.
- We store the data in a JSON file, and use the d3.js library for the visualisation.